Services
Data engineering & analytics
The unglamorous layer everything else depends on: pipelines, warehouses and dashboards that give one honest version of the numbers.
Most companies do not lack data. They lack data they can trust: events that are tracked inconsistently, numbers that differ between two dashboards, and reports someone rebuilds by hand every Monday.
We build the pipeline from source to dashboard — and the tests that keep it correct — so reporting, experimentation and AI features all run on the same foundation.
What we build
What we build
GA4 to BigQuery pipelines
Raw analytics events exported to BigQuery and modelled into sessions, funnels and attribution you can actually query — beyond what the GA4 interface allows.
Data warehouses
A single warehouse combining your product database, analytics and third-party tools, partitioned and modelled for the questions you ask most.
ETL / ELT and orchestration
Scheduled and streaming loads with orchestration, retries and alerting, so a failed job is noticed by an alert rather than by a confused executive.
Dashboards people open
Power BI and Looker dashboards designed around decisions rather than around every metric that happens to exist.
Experimentation and attribution
A/B test analysis, cohort reporting and marketing attribution on data you control.
Data for AI
Enrichment and embedding pipelines that turn raw catalogue, document and event data into something AI features can use.
How we build it
How we keep the numbers right
- A tested transform layer — quality checks run before anything reaches a dashboard
- One definition per metric, documented where people will find it
- Partitioned, cost-aware warehouse design, so queries stay fast and bills stay small
- Monitoring and alerting on freshness and volume
- Everything in version control and reviewable like any other code
How it runs
01
Sources
GA4, app DB, third-party APIs
02
Ingest
batch and streaming loads
03
Warehouse
BigQuery, partitioned
04
Model
tested transform layer
05
Serve
dashboards and reverse ETL
Related work
Shipped, live, in use.
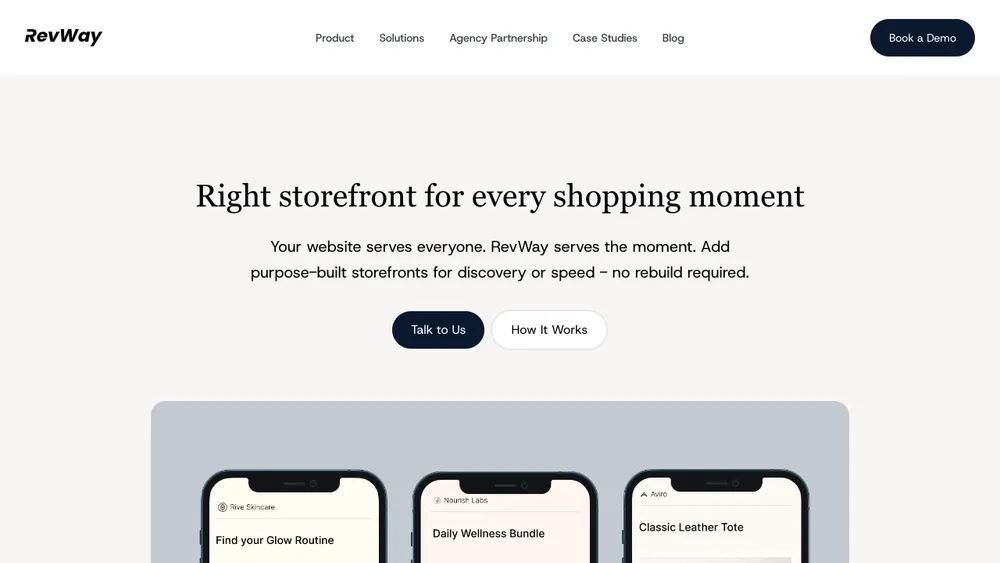
For RevWay we built the GA4 to BigQuery event pipeline and the Power BI dashboards the team runs on, alongside the AI enrichment pipeline.
Questions
Frequently asked
Why export GA4 data to BigQuery?
The GA4 interface samples, thresholds and limits what you can ask. The BigQuery export gives you every raw event, so you can join analytics to your own customer and order data, build custom funnels and attribution, and keep history beyond GA4’s retention limits.
Do we need a data warehouse?
If your numbers live in more than two or three tools and people disagree about which is right, usually yes. If you are early, a well-modelled analytics setup may be enough for now — we will tell you which.
Power BI or Looker?
Whichever your organisation already uses, in most cases. Power BI suits Microsoft-centric teams; Looker and Looker Studio fit naturally with BigQuery and Google Cloud. The warehouse model underneath matters far more than the dashboard tool.
How long does a data pipeline project take?
A first working pipeline with a core set of dashboards typically takes four to six weeks. Broader warehouse builds with several sources are scoped individually.
Start here
Tell us what you are trying to build.
One call, no deck. We will tell you what we would build, what it would cost, and which parts you should not build at all.